
Most Frequent Questions about Share Market or Stock Market
Most Frequent Questions about Share Market or Stock Market
1. What is Stock Market?
The stock market, sometimes referred to as the share market, is a public marketplace where shares of publicly traded corporations are issued and exchanged. It is sometimes referred to as the Stock Exchange. With the goal of obtaining higher returns on investment than those provided by conventional investment tools, investors can purchase and sell shares of various companies here. The primary market, where a previously private firm goes public for the first time with the launch of its Initial Public Offer (IPO), and the secondary market, where shares of all listed companies are traded, are the two types of stock markets. Despite its reputation for volatility, the stock market is also well-known for assisting investors in generating returns that are adjusted for inflation, given enough time.
2. What is Share Market?
Investors can purchase, sell, or trade a variety of market instruments, including shares, bonds, derivative contracts for commodities and currencies, mutual funds, and more, on the share market. The market is divided into two categories: the primary share market, where a business registers initially to raise money from the general public by selling its shares through an IPO, and then goes on to become a publicly traded firm. Subsequently, shares of companies that are already listed are traded at their present price on the secondary share market. Investors are free to enter and depart the market at any moment, as well as purchase and sell shares.
3. What basics of share market investment should I be aware of before investing?
The following are some fundamentals of stock market investing that you should be aware of:
-
You must open a trading account and DEMAT with a broker approved by SEBI
-
Before you start investing, you should think about your investment objectives, preferred investment tenures, and risk tolerance.
-
You need to become familiar with the many exchanges, trading systems, and the fundamental terms used in the stock market.
-
You need to examine the expenses related to investing in the stock market.
-
Diversify your investments rather than putting all of your eggs in one basket.
4. What is Sensex and Nifty?
The Sensex, which combines the phrases “sensitive” and “index,” is the Bombay Stock Exchange’s equity benchmark index. It consists of the top 30 businesses from a variety of industries with free-float market capitalization that trade on the BSE. The S&P Sensex Index, BSE Midcap, and BSE Bankex are just a few of the different Sensex indices available in India.
The Nifty is the Indian National Stock Exchange’s (NSE) equities market index, much like the Sensex is to the BSE. It combines the phrases “National” and “Fifty,” and it includes the top 50 stocks from various industries that trade on the NSE based on free-float market capitalization. Nifty 50, Auto Nifty, Bank Nifty, Nifty IT, and Nifty FMCG are some of India’s most well-known Nifty Indices.
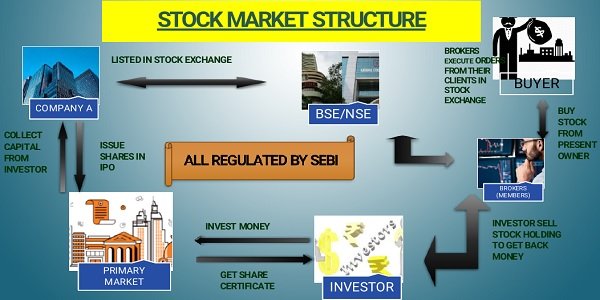
5. What is NSE and BSE?
India’s two main stock exchanges are the NSE and the BSE. The National Stock Exchange is referred to as NSE. Based on the amount of equity trading, it is the fourth-largest exchange in the world. It is notable for being the first stock exchange in India to provide screen-based trading. Then there is the Bombay Stock market, also known as the BSE, which is the first stock market in Asia. With a trading speed of 6 microseconds per order, the BSE is considered the fastest stock exchange in the world.
6. How to start Investing in Share Market?
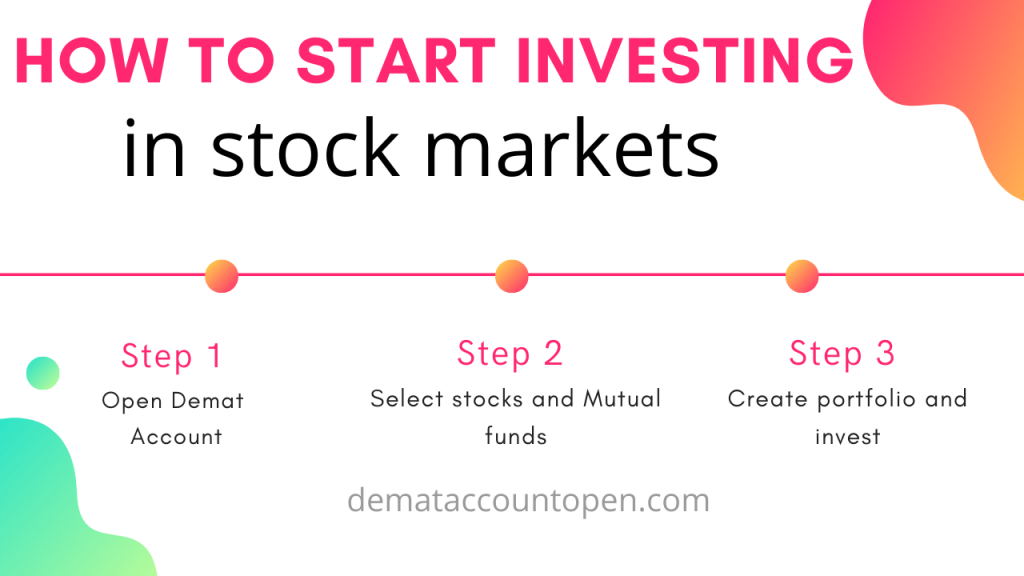
For beginner stock investors, the formula is straightforward. Simply take the actions listed below.
-
To open your DEMAT and trading account, pick a stock brokerage platform that has been recognized and approved by SEBI, such as Mirae Asset.
-
Complete the Know Your Customer (KYC) process and present the required paperwork, including identification, proof of address, and evidence of income.
-
Enter your login and default password to access your DEMAT account, then change it to a secure one. Remember the password.
-
Examine the stocks you want to purchase by taking your desired investment duration, investing goals, and risk tolerance into account. Additionally, evaluate the stocks’ historical performance throughout a range of market cycles to see how consistently they have produced returns.
-
Choose the order quantity and use diversity to maximize your investment portfolio.
7. What are Moving Averages in Stock Market?
Investors and market analysts utilize moving averages as technical indicators in the share market to ascertain a trend’s direction. Technical traders can create a variety of trading signals using a moving average. Moving averages are used by analysts to analyze the support and resistance ratios of an asset and assess price fluctuations. It tracks the asset’s action price to show the direction of a certain trend and assists them in identifying the possible price direction of an asset.
8. What is Volume Indicator in Stock Market?
In essence, share market volume indicators are mathematical formulas that are shown graphically on the most widely used charting platforms. There are various sorts of volume indicators, and each one has a somewhat different formula. As a share trader, you should identify the indicator that best suits your particular market strategy, which is the process you employ to ascertain an asset’s value by examining the selling prices of comparable assets. The On-balance Volume (OBV), Chaikin Money Flow, and Klinger Oscillator indicators are the three most popular kinds of share market volume indicators.
9. What are the Important type of Charts in Stock Market?
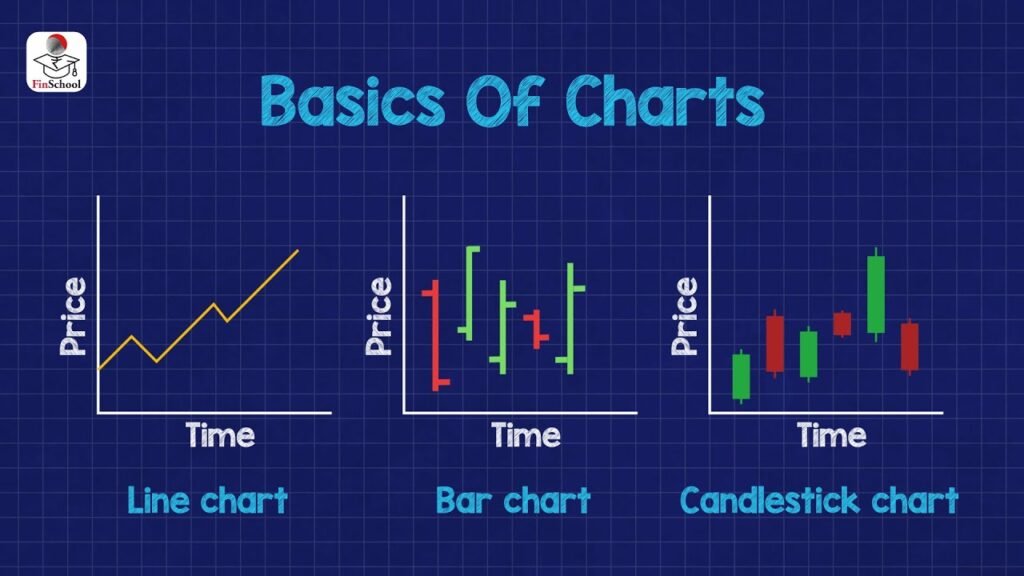
In the stock market, some of the most significant and widely used chart types are as follows:
- Line chart
- Bar chart
- Point and figure chart
- Head and shoulder chart
- Renko Chart
- Candlestick charts with one or more candles
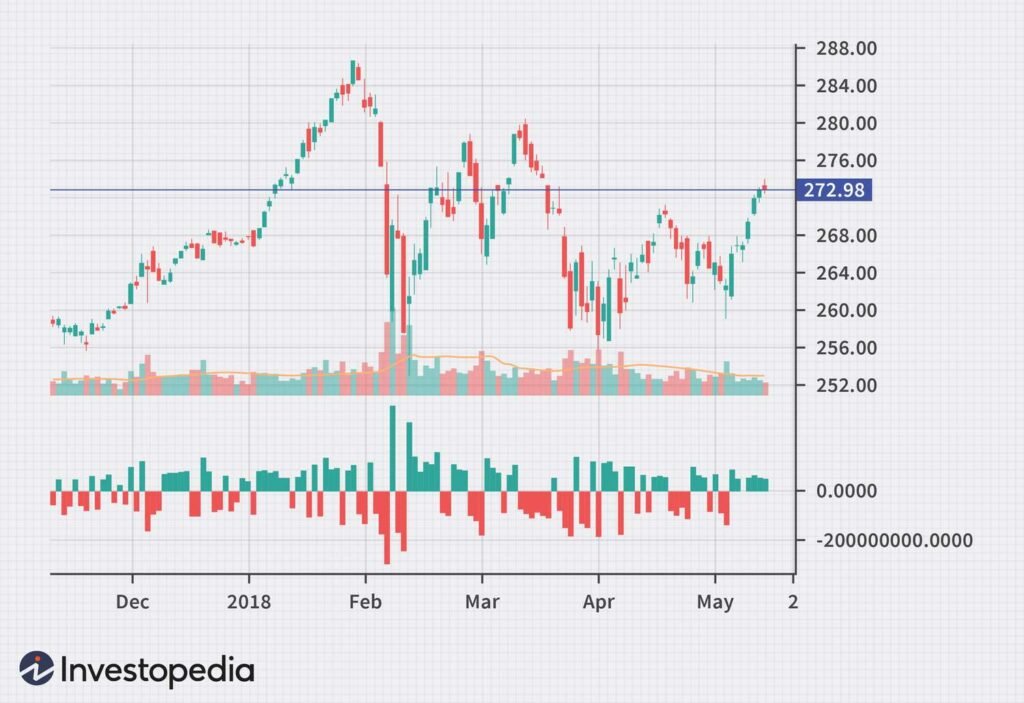
10. What is Candlestick in Share Market?
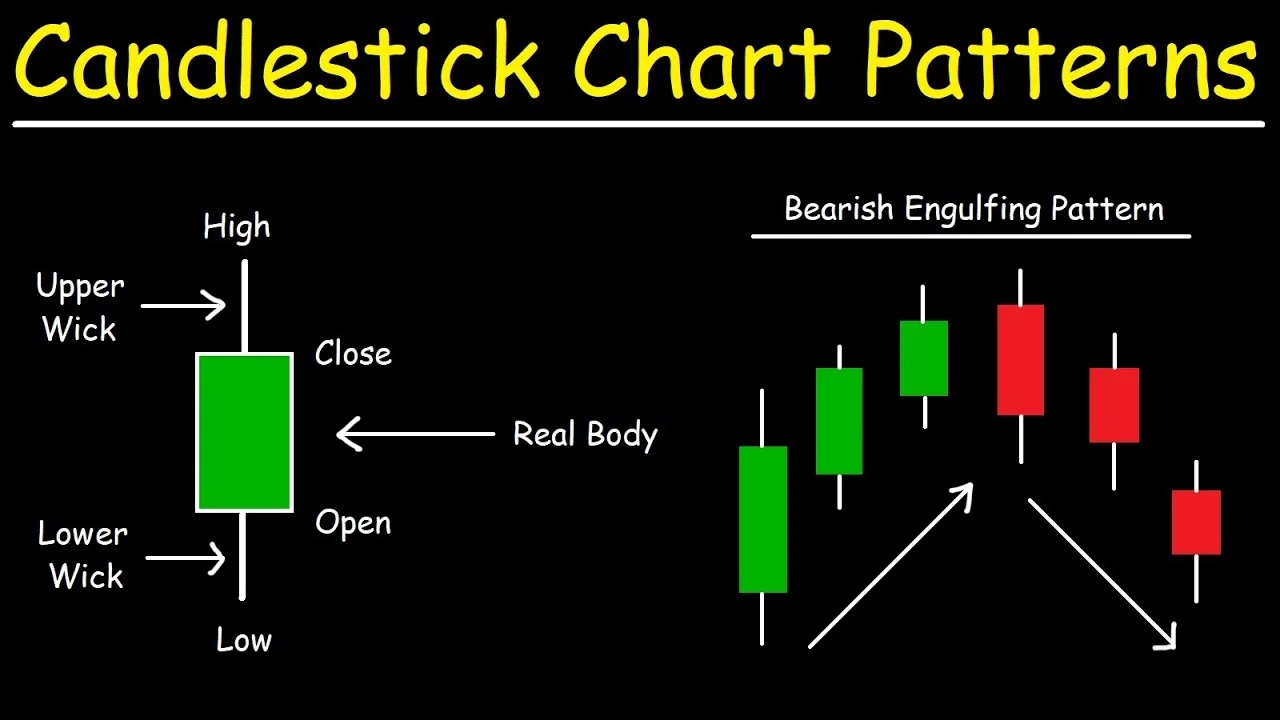
A candlestick is a type of price chart used in technical analysis of market prices in the stock market. This graph shows the opening and closing prices, as well as the highs and lows, of a specific security over a specified time frame. Candlesticks reflect how investor emotion affects securities prices. They are typically used by technical analysts to decide whether to enter or leave trades.